Understanding why websites are slow with Page Speed Insights
Learn how to use Google PageSpeed Insights to identify and fix problems with your website speed. Boost your website's performance and improve user experience.
page speed performance
Website speed is important for many reasons, including user experience, search engine rankings, and conversion rates. Google PageSpeed Insights is a free tool that helps website owners to identify problems with their website speed and provides actionable suggestions for improvement. In this post, we will explain how to use Google PageSpeed Insights to identify problems with your website speed, even if you are a non-technical user.
Using PageSpeed Insights
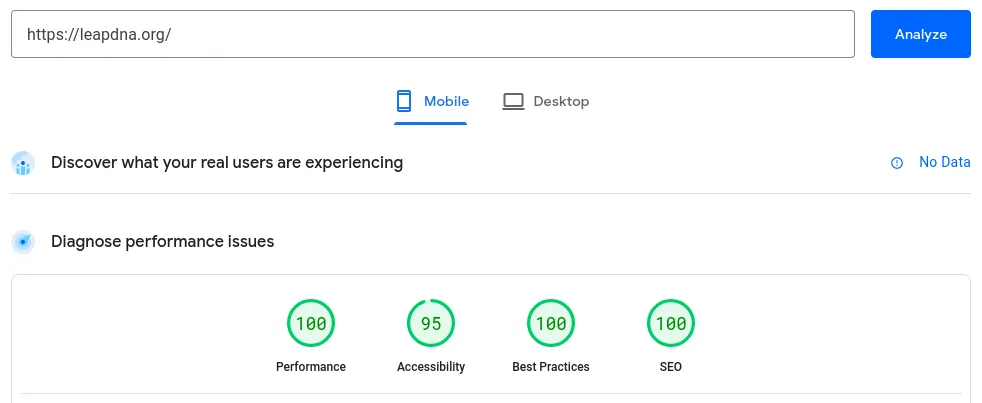
To use Google PageSpeed Insights, simply visit the tool's website and enter your website's URL. Once you click the "Analyze" button, Google will try to find data about your website's performance from real world users and also conduct an analysis on the spot.
If your website is relatively new or it does not have a lot of traffic, real user data might not be available. It is not a problem, since we'll focus on the results of the analysis performed when you clicked analyze to understand page speed issues.
Interpreting the results
<img src="https://negativeepsilon.com/media/attachments/blobs/2023/03/06/K9ssUKEVMTvQnVyRh6PQng_Screenshot_from_2023-03-06_09-09-15.png_JFrZGeGHitUkSiPwzaQ11WNB_5U.webp" alt="A screenshot showing poor results for performance metrics in Page Speed Insights." width="957" height="444">
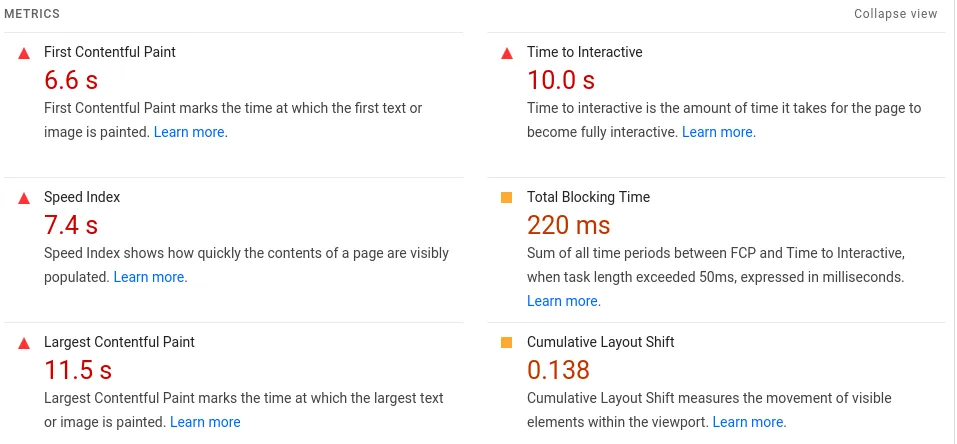
The report generated by Google PageSpeed Insights is divided into several sections, each with its own set of suggestions for improvement. The first tab is the "Performance" section, which provides an overall score for your website's speed. The score ranges from 0 to 100, with higher scores indicating better performance. If your website has a low score, it means there is room for improvement. It is calculated from six indicators which measure how different aspects of your website affect speed:
- First Contentful Paint is the number of seconds until the first text or image appears on the screen.
- Time to Interactive is the time it takes for your page to respond to user interaction like scrolling, clicking or tapping.
- Speed Index is the time it takes for your page to be filled with content. It's measured by taking a video of the page as it loads and counting time until it is stable and no more content appears.
- Total Blocking Time measures the amount of time during which the page is unresponsive to the user (you can think of it as the initial period when the page "hangs" for a bit after loading).
- Largest Contentful Paint is the time at which the largest piece of content in your website is loaded. It serves as an estimate of when your page is visible to users.
- Cumulative Layout Shift is a measure of how much your page's content moves around as it loads. For instance, think about how the text in a blog post moves as images are loaded.
Improving the results
The PageSpeed Insights tool will show opportunities for improvement directly below the metrics on the Performance section. You should start by trying to improve those as they are prioritized by the impact they have on your metrics.
However, some of them (especially the ones below in the "Diagnostics" section) are not possible to implement without diving into the code, so here's an outline of the things you could do without programming:
- First Contentful Paint: the single biggest reason for this metric to be in the red is because of web fonts. You might want to cut back on the number of web fonts you are using for your site. There's also the option of using a default font until your custom fonts have finished loading but that creates a whole new set of problems with Cumulative Layout Shift.
- Time to Interactive: this metric is normally most affected by loading too much JavaScript. The only way of improving this metric that doesn't require diving into the code is removing unused scripts (e.g. if you have multiple analytics scripts you could choose to keep just one).
- Speed index: the way to improve this metric is just to make improvements for the rest, as it is kind of a summary metric.
- Total Blocking Time: like with Time to Interactive, the cause for bad performance on this metric likely has to do with JavaScript, so the only non-technical option is to remove all scripts that you don't need.
- Largest Contentful Paint: there are many ways to improve this metric but we've found that the one that works best is to use properly sized images in next generation formats like WebP. The largest element on websites is generally the hero section which is normally slowed down by a background image or video which is unnecessarily big. You should try to keep your hero images below 1MB for optimal loading.
- Cumulative Layout Shift: the most effective way to improve this metric is to include the
widthandheightattributes inimgandvideoelements. This is not always feasible if you are using a content management system, but it's handled properly most.
Conclusion
Google PageSpeed Insights is a powerful tool that can help website owners to identify problems with their website's speed and take actionable steps to improve it. By following the tips and suggestions provided by the tool, you can significantly improve your website's speed and provide a better user experience for your visitors. However, we understand that website optimization can be overwhelming for some website owners. If you feel like you need some advice on what to do next or would like us to help you improve, please don't hesitate to contact us. We're here to help you improve your website's speed and overall performance. Remember, website speed is important, and it should be a priority for all website owners.
