Improving queue times in large events with maths and cashless solutions
Queue analysis theory is an extensive field in computer science for optimizing servers performance and it is based on mathematical probabilistic models. It has been in use for a while and it can be applied to real-life situations such as lines in supermarkets. In today's post we are going to analyze festival queue times from a mathematical perspective and optimize them with cashless solutions and queue theory.
Everyone that has been to a festival or a huge concert ends up being part of a long queue at some point in the night. It could be at the entrance to the venue or for ordering a drink and it is a horrible situation. The service time is long and as is the amount of people waiting which results in the worst experience possible.
The root of the problem could be the low number of workers compared to the demand but the main cause is the lack of optimization in the process of getting a drink, especially if paying with cash. Today we look at how using a cashless solution could improve service times and dramatically decrease waiting times by using a mathematical probabilistic model. Our analysis shows that optimizing just the payment process significantly reduces cost and waiting time, enabling customers to truly enjoy the event instead of waiting in line.
The mathematical model
In order to model the queues we are going to use the well-known M/M/C model for server queues that estimates how requests enter in the system and the corresponding waiting time due to:
- the number of servers, or bartenders in our problem ($C$),
- the arrival rate ($\lambda$),
- the service rate ($\mu$).
This model has been used in computer science but also for modelling real queues in supermarkets and because of its performance the estimates it provides are widely used.
We will not be going into details about the formulas themselves but the curious readers can get them here. We will be repeatedly calculating average time waiting in the queue ($W_q$) and the bartender's working rate ($\rho$) in different scenarios.
Service Rate
Since the time preparing the drink (around 30s) would be the same for the traditional and the cashless solutions, we are going to focus on the time spent paying for the order.
Let's suppose a person spends 45 seconds paying with cash as an average because of cash exchange, 20 seconds if they pay with card and only 5 seconds if they have a QR code to be scanned.
With this, we can estimate the average time considering three situations: - Traditional method with 30% of customers paying with cash and 70% paying with card - A mixed method where 50% of customers pay with a cashless solution and 50% pay with a traditional method with the same distribution as before - All customers paying with a cashless solution
These situations yield the following results for the service rate:
- $\mu_{\text{traditional}}$ = 62.6 services/hour
- $\mu_{\text{mixed}}$ = 102.85 services/hour
- $\mu_{\text{cashless}}$ = 77.83 services/hour
The arrival rate
Then we have to predict the arrival rate and in order to do so let's assume it follows this formula
$$\lambda = \frac{N * d}{t*m}$$
where - $N$: venue capacity - $d$: number of drinks the average customer orders during their stay at the event - $t$: time the event lasts for - $m$: average number of drinks per order (customers often order together)
The formula above translates to uniformly distributing the total number of drinks during the event grouped by drinks per order.
Results: Traditional vs Cashless
Now that we have the model lets try it with some data and an online calculator.
We will carry out two experiments based on the guest/bartender ratio - Keep the same ratio for all the payment solutions (near to 100 guests per bartender) - Add the possibility to increase it on the cashless model
Same ratio for all the payment solutions
For this experiment we'll look at what the model predicts for events of different size while keeping the guest/bartender ratio constant (around 100) and conditioning on the following parameters to estimate the arrival rate:
- number of drinks per person $d=3$
- number of hours $t=6$
- average drinks per order $m=2$
With this, let's look at the results:
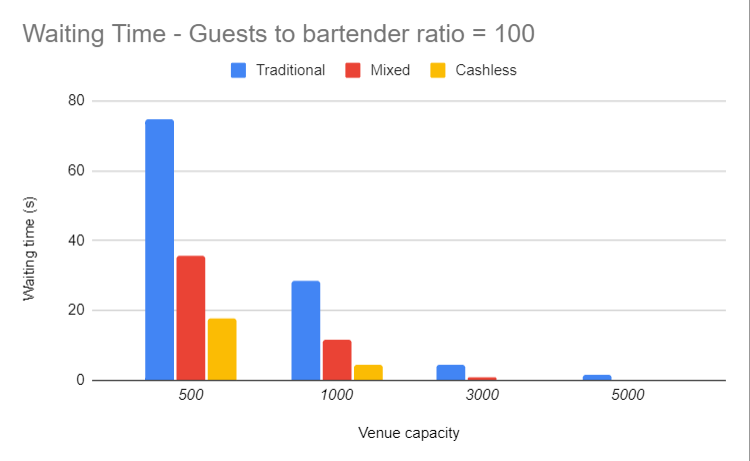
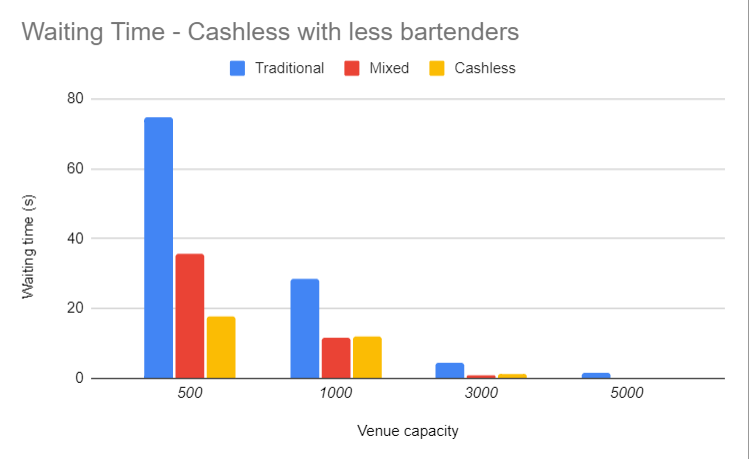
As we can see above, for a venue capacity of 500 people, the mixed solution has 50% the waiting time of the traditional model but the cashless solution has only 25% of the queue time.
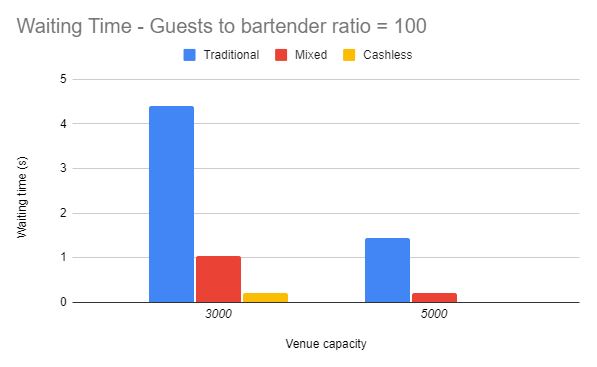
The results get even better when the venue capacity increases. Since the difference of waiting time is hard to see we are going to plot this as a "times faster" plot.
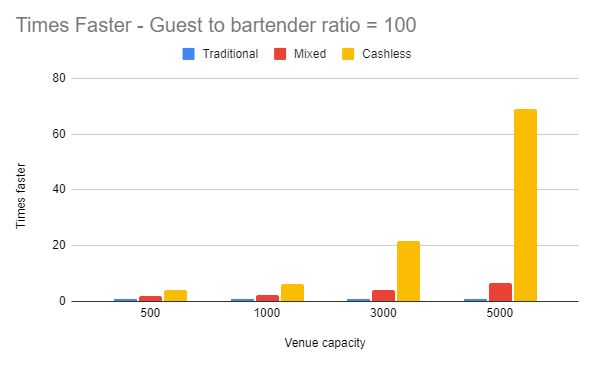
So, when the venue capacity increases, the performance of a mixed solution is much better but the cashless solution outperforms both of them.
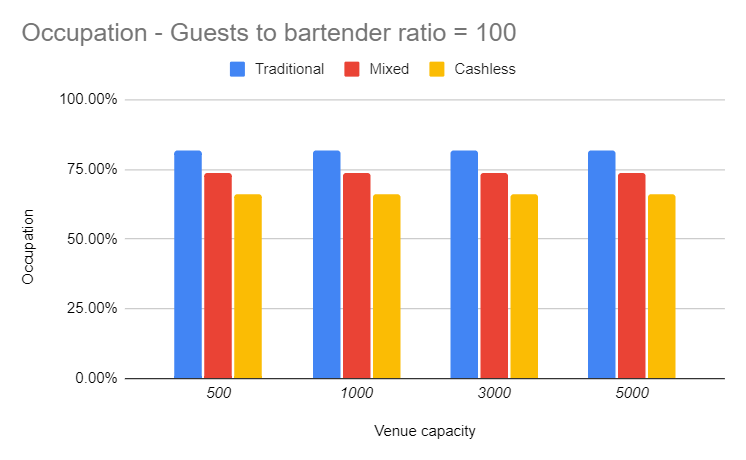
Finally we are looking at the occupation rate of the bartenders. Even if the cashless solution is much faster, the bartenders are less busy compared to the other two solutions.
Increasing the guest to bartender ratio for the cashless solution
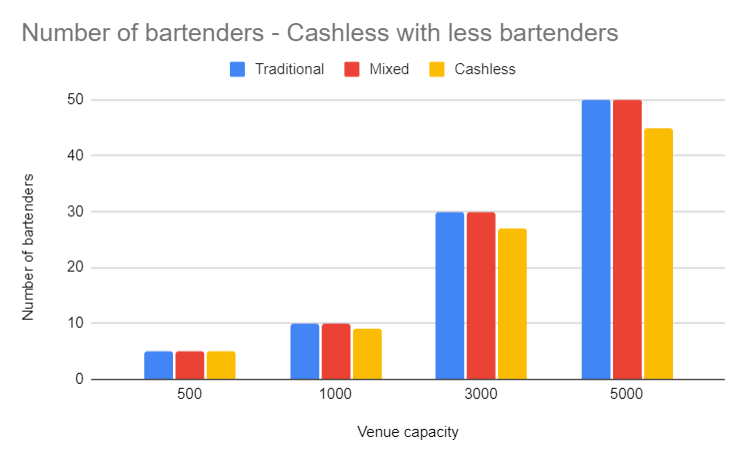
Now let's add the possibility to increase the guest/bartenders ratio in the cashless solution. Since we saw the occupation rate was lower for the cashless solution in the previous case, we would like to check if this solution can tolerate a higher ratio or even also yield a better result.
So let's get the data!
Also, we can see that the occupation rate now is similar to the mixed solution.
In conclusion, with less bartenders and a 100% cashless solution the results are
- reduction in the average waiting time, and also
- reduction in the occupation rate of the bartenders.
Our solution - Festea Pay
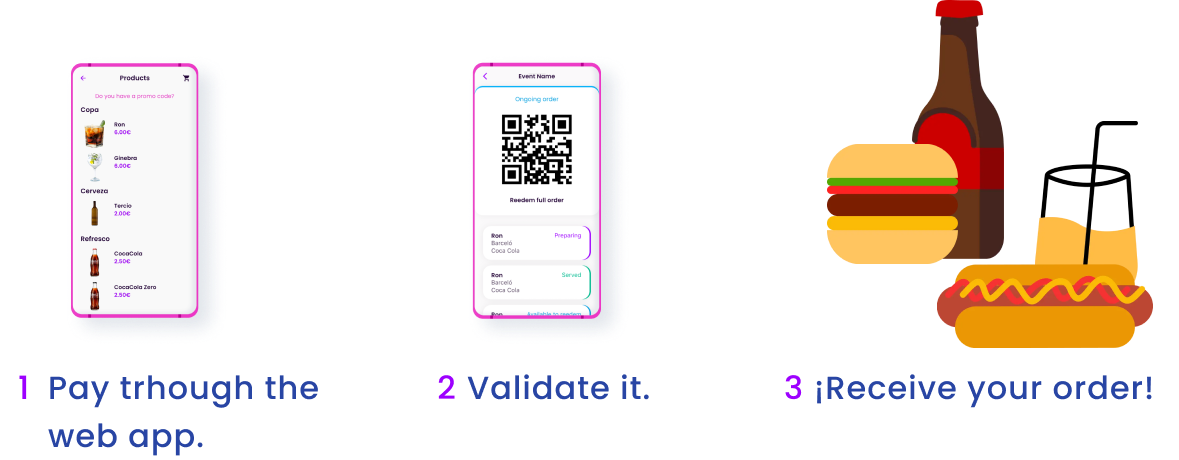
In order to help venues take advantage of cashless, we've developed a mobile web app that implements a simple payment flow of 3 steps in order to buy your drink integrated with Google/Apple pay. It generates a QR code to be scanned by bartenders freeing them from having to take payment manually.
Focusing on UX and UI design, we've crafted the payment flow to be as simple and intuitive as possible.
You can check our website and test it to support our project.
Thanks for reading! Hopefully you will be able to get your drinks faster if our sales person does their job!
